Chosen theme: Real-Time Data Visualization in Finance. Watch the market breathe in front of you—streams of ticks, shifting liquidity, and evolving risk transformed into visuals that inform faster, smarter decisions. Subscribe to stay close to new techniques, stories, and hands-on guidance.
From Delayed Reports to Live Insight
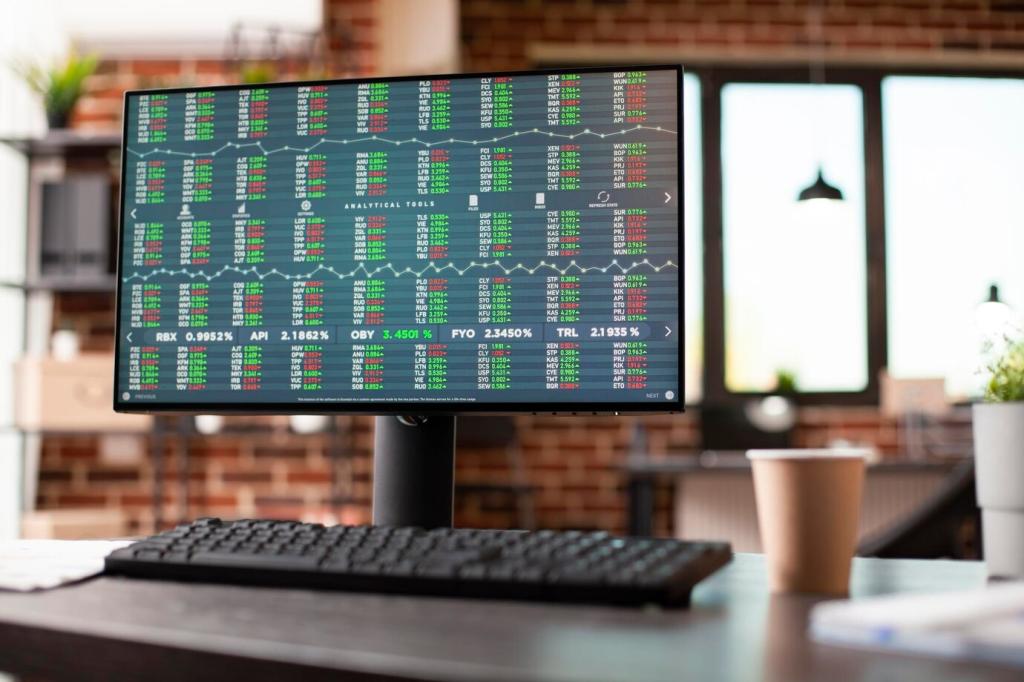
End-of-day PDFs once guided conversations; now they arrive too late to shape outcomes. Real-time dashboards transform raw streams into living context, revealing trend shifts, liquidity fractures, and counterparty behavior precisely when it matters most.
Decisions in Milliseconds
Market makers, execution algos, and treasury desks navigate micro-movements where milliseconds define slippage and opportunity. Visualizing order flow, spreads, and queue dynamics in real time reduces hesitation, aligns teams, and tightens feedback loops under pressure.
A Trader’s Anecdote
One FX trader recalls a sudden heatmap flare on emerging-market quotes, seconds before headlines appeared. Seeing liquidity thin, she reduced exposure early, preserving gains. Share your near-miss or save-the-day moments so others can learn from your experience.

Color Encoding and Cognitive Load
Avoid carnival palettes. Use restrained hues for baseline state and saturated accents for change. Red-green conflicts can mislead; consider blue-orange or texture cues. The goal is instant comprehension, not decoration, especially when spreads are widening.
Clarity Under Pressure
Prioritize legibility and hierarchy. Reserve large typography for key risk metrics, keep gridlines subtle, and label directly to reduce scanning. During volatility, the right layout can shave seconds and prevent costly, impulse-driven mistakes.

Accessible, Responsible Defaults
High-contrast modes, keyboard navigation, and screen-reader labels broaden reach and reduce fatigue during marathon sessions. Share your team’s accessibility wins, and subscribe for checklists that keep real-time dashboards inclusive without sacrificing performance.
Use Cases Across the Financial Stack

Algorithmic Trading and Execution
Live order book imbalance, microprice drift, and queue position visuals help tune aggressiveness and minimize slippage. Execution teams monitor venue microstructure and smart-routing outcomes, turning complex dynamics into intuitive, actionable feedback loops.

Intraday Risk and Treasury
Heatmaps of VaR contributions, stress metrics, and funding gaps let teams preempt trouble before close. Real-time exposure ladders and collateral flows surface dependencies, supporting nimble hedges when basis moves faster than governance can email.

Compliance and Surveillance Visualized
Pattern timelines display spoofing-like sequences, alert clusters, and message trails, reducing investigative drag. Visual correlation between chat events and trade bursts tightens oversight. Tell us which signals you wish were clearer, and we’ll explore designs.

Tools, Stacks, and Practical Choices
Reliable distribution often pairs message brokers with backpressure control and exactly-once semantics where possible. WebSockets or server-sent events stream to browsers; careful batching smooths updates without hiding critical microstructure changes during spikes.
Your First Real-Time Finance Dashboard: A Pragmatic Path
Pick two symbols, one venue, and three metrics: spread, depth, and volume. Wire a minimal pipeline, chart with a conservative palette, and ship to a small user group. Feedback beats speculation every single time.
Your First Real-Time Finance Dashboard: A Pragmatic Path
Measure latency from source to pixel, log dropped updates, and surface health indicators directly on the dashboard. Trust grows when teams can see the system’s pulse alongside price, depth, and risk signals in real time.
Your First Real-Time Finance Dashboard: A Pragmatic Path
Record decisions tied to visuals and outcomes. Did the heatmap nudge an exit earlier? Celebrate wins, examine misses, and refine cues. Comment with your iteration stories, and subscribe for structured retrospectives you can reuse.